



Gold and silver have held a special place in the history of money for centuries. Circulation and commemorative coins were minted from them, asset value was preserved in them, and their mutual ratio was one of the most important issues in monetary policy and trade. For numismatists, this ratio is not only data from the precious metals market, but also an important indicator for understanding the value of numerous gold and silver coins that appear on the numismatic market today.
One of the simplest ways to compare the value of gold and silver is to answer the question: How many grams of silver are needed for the value of one gram of gold?
If the ratio is 30 : 1, that means one gram of gold is worth as much as 30 grams of silver. If the ratio is 80 : 1, then it takes a full 80 grams of silver to equal the value of one gram of gold. The higher that number, the cheaper silver is relative to gold. The lower it is, the relatively stronger silver is.
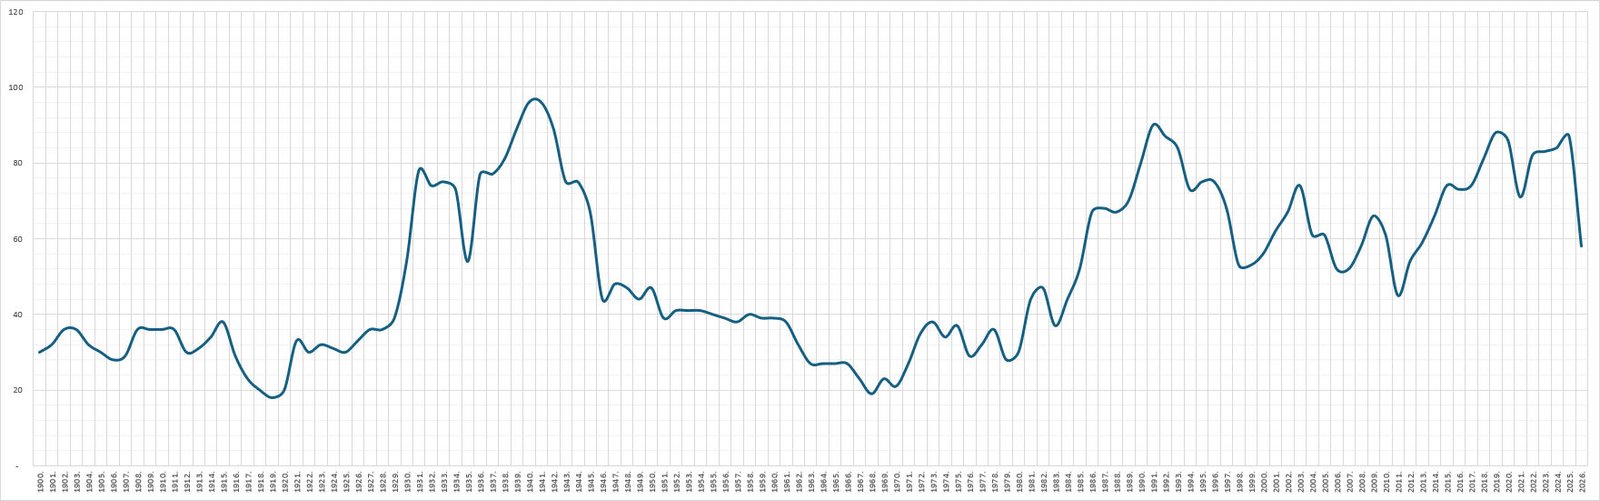
For the historical overview from 1900 to 2025, data from the U.S. Geological Survey (USGS) was used, converted into value per gram of pure metal. For the year 2026, data for the first quarter was added according to World Bank data, since final annual data for the current year does not yet exist. Therefore, the year 2026 must be viewed as a current indicator of market movement rather than as a final annual value.
The gold-to-silver ratio at the beginning of the 20th century
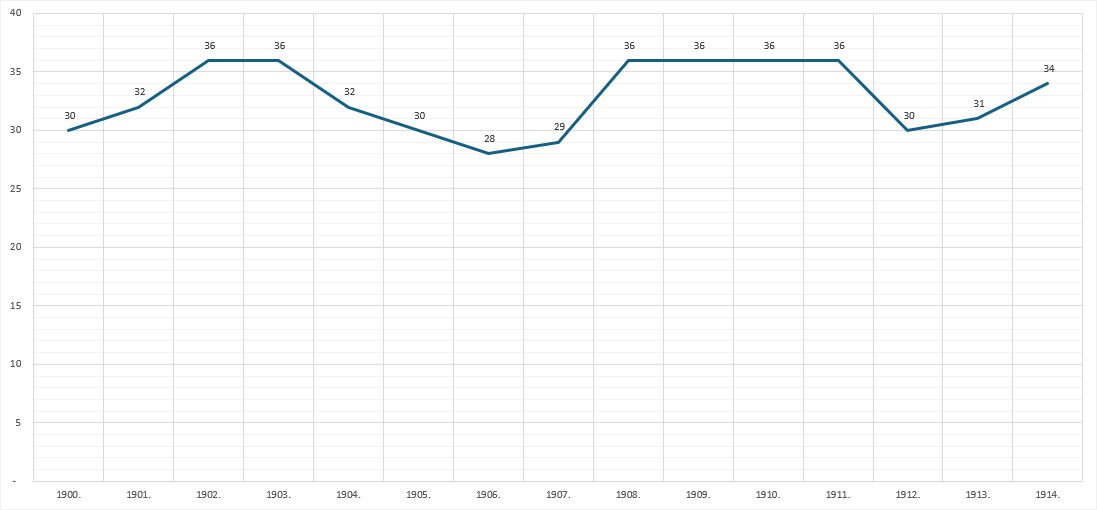
At the beginning of the 20th century, the gold-to-silver ratio was significantly lower than in most of the modern period. In 1900, one gram of gold was worth as much as 30.45 grams of silver. In the period from 1900 to 1914, the average ratio was 32,78 : 1.
| Year: | Grams of silver needed for 1 gram of gold: |
|---|---|
| 1900. | 30,45 |
| 1905. | 30,35 |
| 1910. | 35,76 |
| 1914. | 33,89 |
This period is particularly interesting to numismatists who deal with gold and silver coins of the Austro-Hungarian Monarchy, the Latin Monetary Union, and other European states of that time. Gold and silver coins were then not only objects of collection or investment, but an integral part of the actual monetary system.
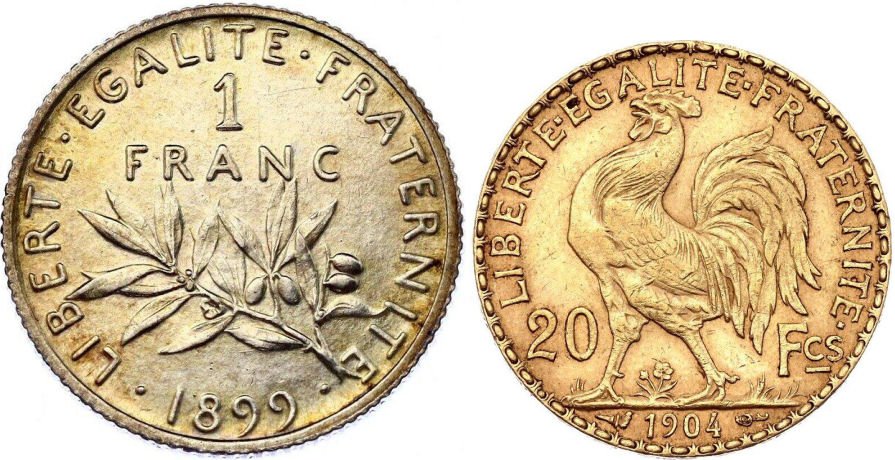
Precisely for this reason, today's comparison of the metallic value of Austro-Hungarian crowns, francs, dinars, or gold ducats with their former value should be viewed with caution. The ratio of gold to silver at the time of their issuance was significantly different from today's.
World War I and historically strong silver
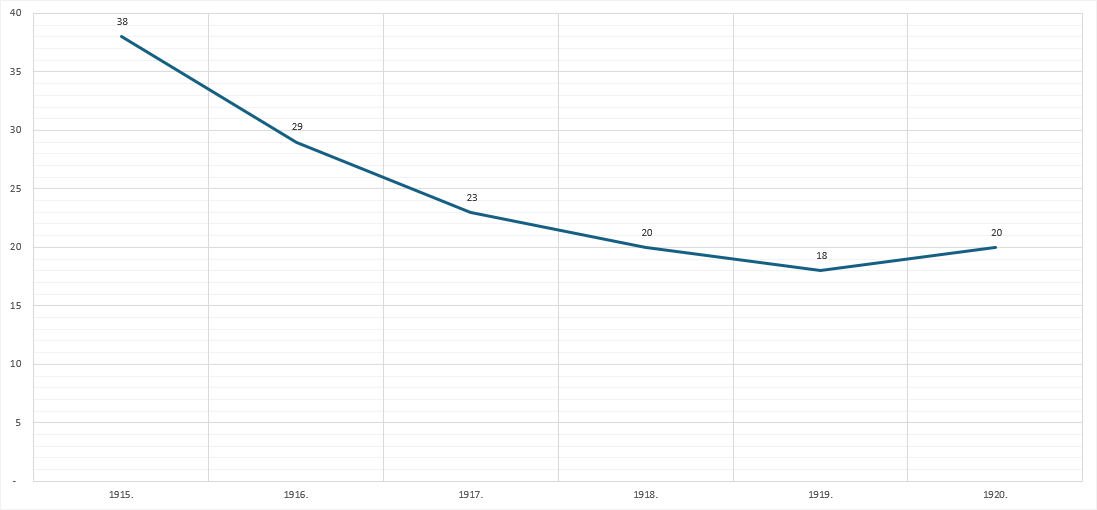
During the First World War, the gold-to-silver ratio began to fall sharply. In 1915, it stood at 37.56 : 1, and by 1918 it had already dropped to 20.16 : 1. The lowest value in the entire observed period was recorded In 1919, when the value of only one gram of gold required 17.81 grams of silver.
| Year: | Grams of silver needed for 1 gram of gold: |
|---|---|
| 1915. | 37,56 |
| 1917. | 23,30 |
| 1918. | 20,16 |
| 1919. | 17,81 |
| 1920. | 20,12 |
In other words, silver was stronger relative to gold in 1919 than in any other year covered by this analysis.
For numismatists, this is also important due to the historical moment of the dissolution of the Austro-Hungarian Monarchy, the emergence of new states, and major monetary changes. Silver coins minted during that period were created in a world where silver held a significantly stronger value position than it does in most of today's market.
The Great Depression and the strong dominance of gold
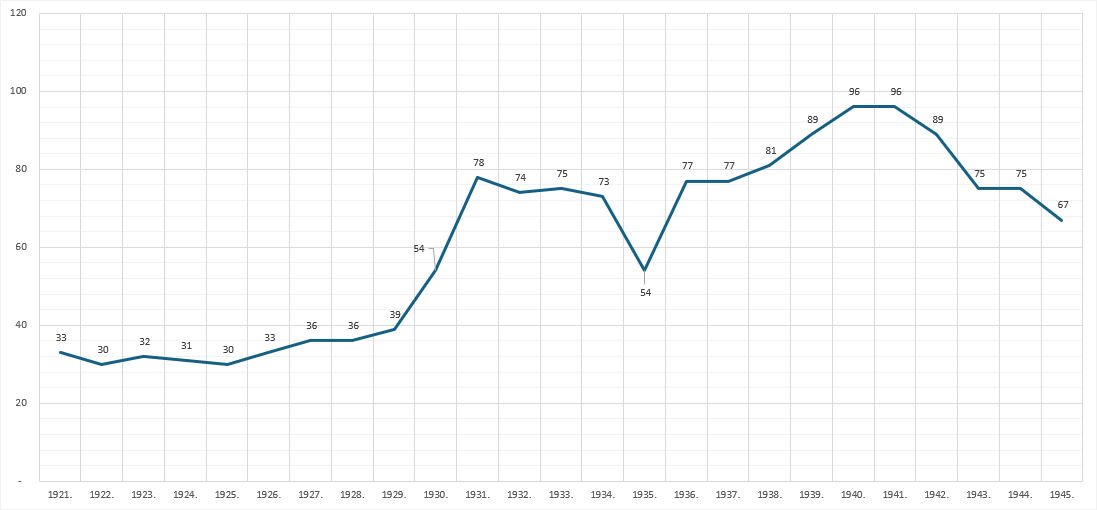
After the relatively stable 1920s, during which the ratio mostly hovered between 30 and 39 grams of silver per gram of gold, a major turnaround occurred in the early 1930s.
In 1930, the ratio rose to 54.26 : 1, and as early as 1931, it reached 77.58 : 1. The highest value in the entire observed series was recorded 1940 and 1941, when one gram of gold was worth as much as 96.46 grams of silver.
| Year: | Grams of silver needed for 1 gram of gold: |
|---|---|
| 1929. | 39,00 |
| 1930. | 54,26 |
| 1931. | 77,58 |
| 1939. | 88,80 |
| 1940. | 96,46 |
| 1941. | 96,46 |
| 1945. | 67,07 |
The average ratio for the period from 1930 to 1945 amounted to as much as 76,99 : 1. That was a period of pronounced gold supremacy over silver, marked by economic crisis, monetary uncertainty, and wartime circumstances.
In times of great uncertainty, gold is traditionally perceived as one of the most important forms of value preservation. Meanwhile, silver does not lose its economic and monetary importance, but its relative value compared to gold can weaken significantly.
The post-war period and the resurgence of silver
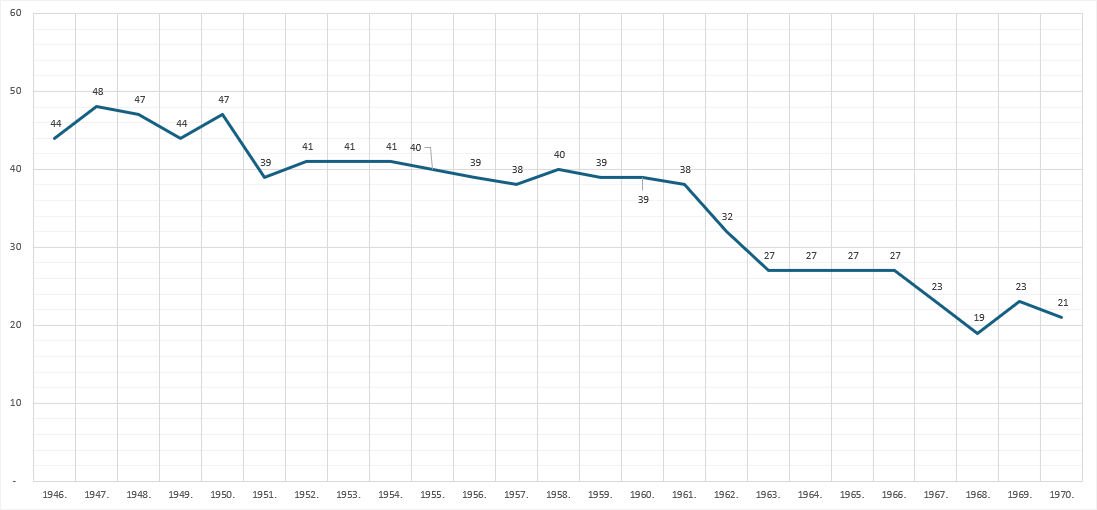
After the Second World War, the gold-to-silver ratio decreased again. From 1946 to 1970, it averaged 35,61 : 1, almost the same as at the beginning of the 20th century.
The period of the 1960s is particularly interesting. The ratio gradually decreases from 38.57 : 1 in 1960, falling to just in 1968 18,75 : 1. That is the second lowest value in the entire series, immediately following the year 1919.
| Year: | Grams of silver needed for 1 gram of gold: |
|---|---|
| 1950. | 47,06 |
| 1960. | 38,57 |
| 1963. | 27,43 |
| 1967. | 22,69 |
| 1968. | 18,75 |
| 1970. | 20,56 |
For numismatists, this period holds special significance. It was precisely during the 1960s that many countries gradually withdrew silver from circulating currency or reduced its proportion in coins. The intrinsic metal value of silver coins could increasingly no longer remain aligned with their face value.
Because of this, numerous silver coins from the second half of the 20th century are viewed today in two ways: as collector's items, but also as pieces whose metal value constitutes an important part of the market price.
The seventies and the rise of precious metals
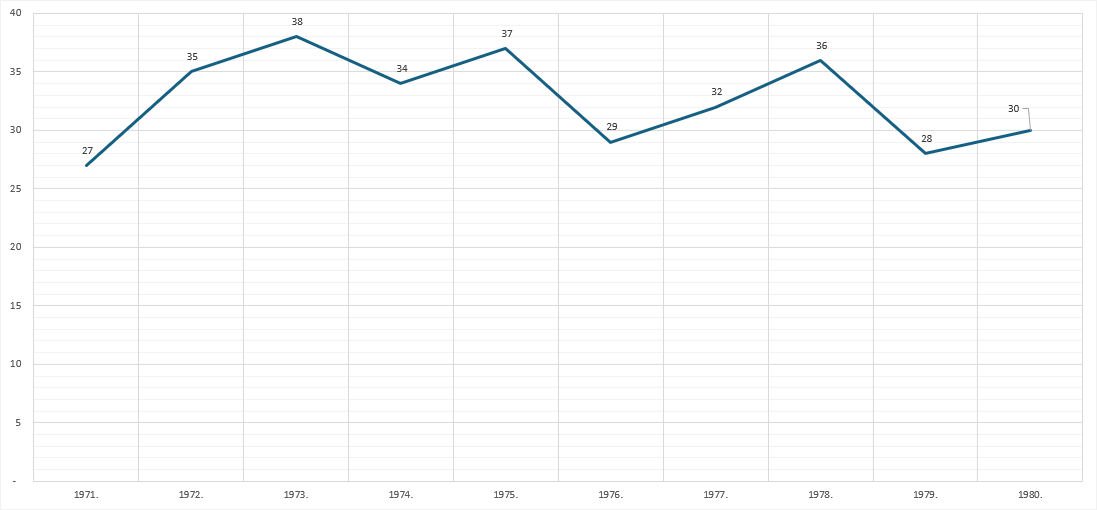
During the 1970s, precious metal prices grew strongly. However, the gold-to-silver ratio remained relatively low during that period. The average for the period from 1971 to 1980 was 32,43 : 1.
In 1980, known for strong market movements of precious metals, one gram of gold was worth as much as 29.70 grams of silver.
| Year: | Grams of silver needed for 1 gram of gold: |
|---|---|
| 1971. | 26,69 |
| 1974. | 33,95 |
| 1978. | 35,83 |
| 1979. | 27,73 |
| 1980. | 29,70 |
This data shows that a rise in the price of gold does not necessarily mean a weakening of silver. In periods when both metals are growing strongly, silver can grow faster than gold, so their mutual ratio decreases.
From the 1980s to the early 21st century: silver weakens again against gold
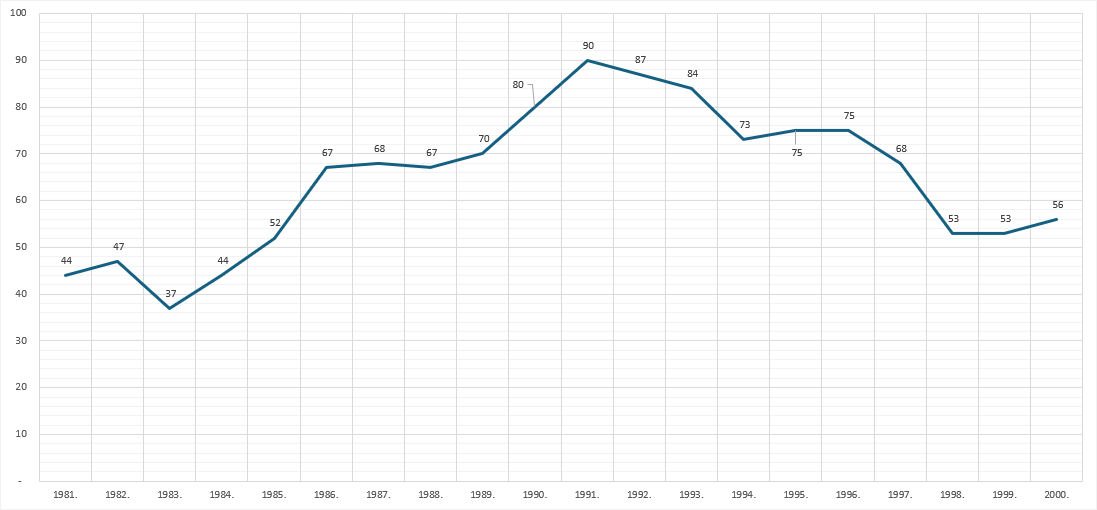
After 1980, the gold-to-silver ratio rose again. In 1985, it was 51.67:1, by 1990 it was already 80.00:1, and in 1991 it reached 90.00:1.
| Year: | Grams of silver needed for 1 gram of gold: |
|---|---|
| 1980. | 29,70 |
| 1985. | 51,67 |
| 1990. | 80,00 |
| 1991. | 90,00 |
| 1995. | 74,70 |
| 2000. | 55,96 |
The average ratio for the period from 1981 to 2000 was 64,54 : 1. Compared to the beginning of the century, when one gram of gold was generally worth about thirty grams of silver, it is clear how much the value ratio of these two metals has changed.
For collectors, this means that in the modern period the bullion value of gold coins has grown significantly stronger compared to silver coins. Although rarity, condition, and demand among numismatic specimens are often more important than the value of the metal, in the case of common gold and silver coins, this relationship is directly reflected in market prices.
Silver in the 21st century
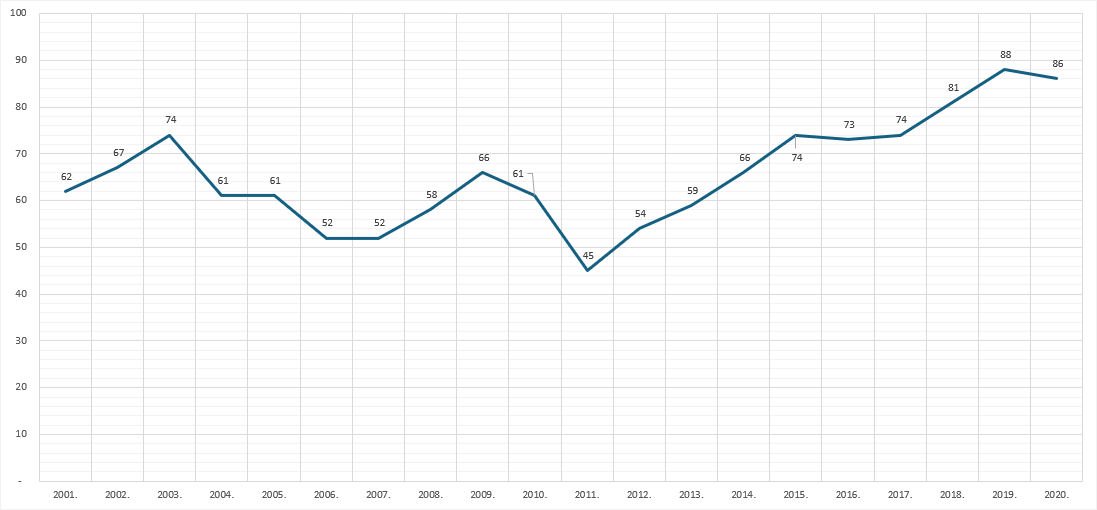
At the beginning of the 21st century, the gold-to-silver ratio remains mostly high. From 2001 to 2010, the average was 61,56 : 1. Then comes the year 2011, when silver rises strongly against gold, so the ratio drops to 44,78 : 1.
However, that trend did not persist in the long term. From 2015 onward, gold has once again been outperforming silver more strongly, and since 2018, the ratio has entered the territory above 80:1.
| Year: | Grams of silver needed for 1 gram of gold: |
|---|---|
| 2000. | 55,96 |
| 2005. | 60,59 |
| 2010. | 61,34 |
| 2011. | 44,78 |
| 2015. | 74,06 |
| 2018. | 80,83 |
| 2019. | 87,70 |
| 2020. | 86,23 |
The year 2011 represents an interesting exception in the contemporary period. Back then, silver, at least relative to gold, briefly showed strength more characteristic of earlier historical periods.
From the record dominance of gold in 2025 to the strong recovery of silver in 2026
According to USGS data, in 2021 one gram of gold was worth as much as 71.39 grams of silver. Already in 2022, the ratio increases again to 82.31 : 1, and in 2025 it reaches 86,84 : 1.
Such a ratio showed a very strong dominance of gold over silver. However, the data for the first quarter of 2026 brings an important change. According to World Bank data, the average price of gold in the period from January to March 2026 was 4,876 US dollars per troy ounce, while the average price of silver was 84.0 US dollars. Thus, the ratio dropped to approximately 58,05 : 1.
| Year | Gold, USD/g | Silver, USD/g | A gram of silver for a gram of gold |
|---|---|---|---|
| 2021. | 57,90 | 0,811 | 71,39 |
| 2022. | 57,90 | 0,703 | 82,31 |
| 2023. | 62,53 | 0,757 | 82,63 |
| 2024. | 76,78 | 0,912 | 84,17 |
| 2025. | 106,10 | 1,222 | 86,84 |
| January – March 2026 | 156,77 | 2,701 | 58,05 |
This change is particularly interesting because it did not happen due to a drop in the price of gold. On the contrary, in the first quarter of 2026, gold was significantly more expensive than in the previous year. However, silver grew even more strongly in the same period, causing the ratio to drop in a short time from nearly 87 : 1 to approximately 58 : 1.
That is a good example of why the gold-to-silver ratio should not be viewed solely through the movement of a single metal. Gold can rise while silver simultaneously grows stronger against it if its price increases faster.
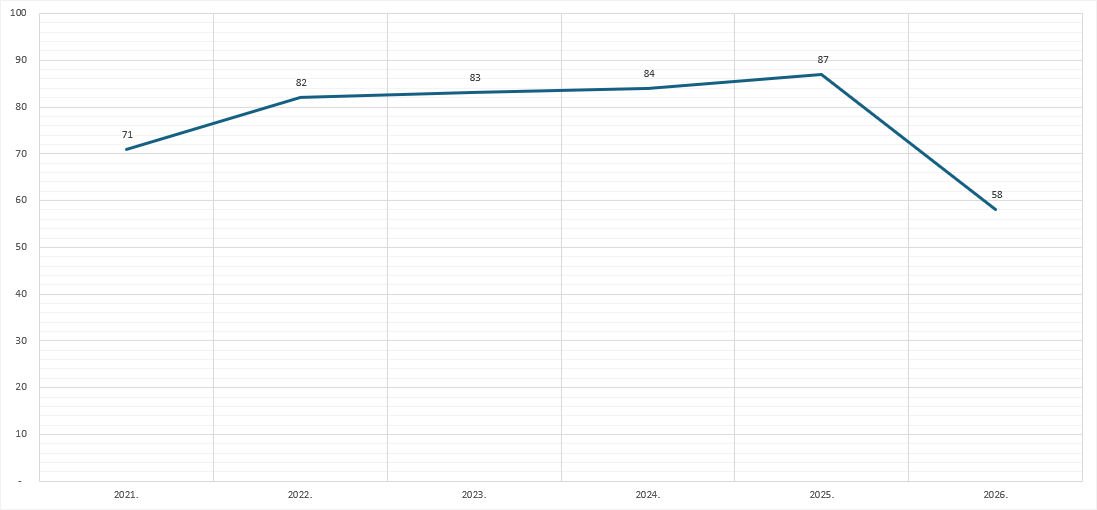
It should be emphasized, however, that the data for 2026 covers only the first three months of the year. It shows a strong shift in the market, but does not yet represent an annual result that could be fully and equally compared with completed annual data from previous periods.
Most important historical points
| Period or year | A gram of silver for a gram of gold | Meaning |
|---|---|---|
| 1900–1914, average | 32,78 | relationship characteristic of the early 20th century |
| 1919. | 17,81 | lowest annual ratio in the observed period |
| 1930–1945, average | 76,99 | strong dominance of gold |
| 1940 and 1941. | 96,46 | highest annual ratio in the observed period |
| 1946–1970, average | 35,61 | renewed strengthening of silver |
| 1968. | 18,75 | second lowest annual value |
| 1971–1980, average | 32,43 | silver relatively strong |
| 1981–2000, average | 64,54 | longer-term weakening of silver |
| 2001–2025, average | 68,92 | modern high ratio |
| 2025. | 86,84 | marked predominance of gold |
| January – March 2026 | 58,05 | strong recovery of silver towards gold |
Is silver undervalued compared to gold today?
If only the data up to 2025 were observed, the conclusion would be quite clear: silver was at a very low relative value compared to gold. The ratio of 86,84 : 1 it was significantly higher than the average of most observed periods and approached the highest historical levels recorded during the 1940s and the early 1990s.
However, the data for the first quarter of 2026 significantly changes the picture. The drop in the ratio to approximately 58 : 1 shows that silver has strongly recovered against gold in a short period of time. That ratio is lower than the average of the 2001–2025 period, which is 68.92 : 1, as well as the average of the 1981–2000 period, which is 64.54 : 1.
Therefore, based on the latest available data, it can no longer be simply claimed that silver is significantly undervalued relative to gold. Compared to the very high values from 2020, 2024, and especially 2025, silver has clearly strengthened considerably.
However, the 58:1 ratio is still significantly higher than the ratio that prevailed in the early 20th century, the post-war period, and during the 1970s, when a gram of gold most commonly required between approximately 20 and 40 grams of silver. Viewed from this longer historical perspective, silver has still not reached the relative strength it held in many earlier periods.
The most cautious conclusion would therefore read: Silver was heavily undervalued relative to gold throughout 2025, but in early 2026 it staged a strong recovery and moved back closer to its modern historical average.. Whether that shift will remain a permanent change or just a short-term market phenomenon can only be more reliably assessed after the end of 2026.
What does that mean for numismatists?
For the numismatic audience, the gold-to-silver ratio is not merely abstract stock market data. It directly reflects on the market value of numerous coins.
For gold coins whose rarity is not pronounced, for example certain ducats, 10 and 20 crowns, francs, marks, or sovereigns, the value of the gold often represents the bulk of the market price. The same applies to numerous common silver coins, restrikes of Maria Theresa thalers, crowns, florins, dinars, shillings, and commemorative silver coins, especially when it comes to poorly preserved or very common specimens.
A high gold-to-silver ratio means that gold coins, in terms of their metal value, are significantly more expensive relative to silver coins than in many earlier historical periods. A decrease in this ratio, such as that recorded in early 2026, means that silver coins are gaining value faster than gold coins, at least when looking at the precious metal content.
This is especially important for common silver coins whose market value is close to the value of the silver they contain. In the case of rare specimens, top conditions, and sought-after types, the numismatic premium can still vastly exceed the value of the metal itself.
That is precisely the special appeal of silver: it simultaneously belongs to the world of precious metals, industrial consumption, and numismatics. Its value can grow strongly, but it can also lag behind gold for a long time. Historical data from 1900 to the first quarter of 2026 show that this ratio has changed dramatically over time, ranging from less than 18 grams of silver for a gram of gold to nearly 100 grams of silver for the same amount of gold.
The latest data shows that after a long period of underperformance relative to gold, silver has made a strong return to the spotlight. For collectors of gold and silver coins, this is an additional reminder that the value of numismatic items, especially common ones made of precious metals, should never be viewed separately from the broader market movements of gold and silver.
Methodological note: Historical USGS data for the period from 1900 to 2025 was converted into value per gram of pure gold and silver, after which the mutual ratio was calculated. The data for 2025 in the USGS source is marked as an estimate. The data for 2026 is based on the average market prices of gold and silver for the period from January to March 2026 according to World Bank data and does not represent a completed annual average. The article is of an informational nature and does not constitute a recommendation for the purchase or sale of precious metals.
Data sources: U.S. Geological Survey, Historical Statistics for Mineral and Material Commodities in the United States, Data Series 140, historical statistics for gold and silver; U.S. Geological Survey, Mineral Commodity Summaries 2026, Gold and Silver; World Bank, Commodity Markets Price Data – The Pink Sheet, April 2, 2026 edition.
Author: Zlatko Viščević with AI assistance
Photos: Katz Auction